Introduction
Datadog is a monitoring and analytics tool used by Information Technology (IT) and DevOps teams to determine performance metrics and event monitoring for infrastructure and cloud services. The tool can monitor resources such as servers, databases, and tools.
- In this documentation, we will be talking about how we can leverage Datadog to monitor infrastructure on the AWS cloud. We will be monitoring AWS resources like EC2 instances and RDS Databases.
- We will be creating Datadog Dashboards which helps in visually tracking, analyzing, and displaying key performance metrics, and will also take a look at how to enable monitoring, for the health of our infrastructure.
- We will also try to establish an Alerting Mechanism using Monitors in Datadog. This will help us get notified when metrics reach their threshold or things go wrong, so we can take remedial actions.
Background
For our use case, we are focusing on infrastructure in the AWS cloud. Although we have a native AWS CloudWatch service to monitor the infrastructure, but there are some limitations to using CloudWatch.
For example, there is no dedicated dashboard option where we can list multiple services and resources, which can be quite helpful in enterprise-level environments.
Taking into consideration the limitations, let’s proceed with Datadog dashboards & monitors creation with infrastructure monitoring and alerting.
Configuring Datadog
Prerequisites
As a part of the prerequisite, we need to have some infrastructure in AWS. To keep the use case simple, we would be monitoring a 2 Tier Application, which consists of an EC2 instance etc.
We can divide Datadog Monitoring Configuration into 6 Steps.
Step 1: Creating your Account on Datadog
We need to sign up and create a Datadog account.
URL: https://app.datadoghq.com/signup. At the enterprise level, we can sign in using SSO.
Fig 1. SignUp on Datadog
Step 2: Choose your Stack
Once we are signed in, we need to choose a stack. It is nothing but a list of services and pieces of software that we can integrate using Datadog. Since we are monitoring resources on AWS, we can click on the AWS tile.
Fig 2. Choosing the right stack
Step 3: Installing the Datadog Agent
The Agent is lightweight software installed on your hosts. It reports metrics and events from your host to Datadog using integrations. An agent can be installed on a variety of platforms. In our case, since our application is hosted on an EC2 instance & that instance is an Amazon Linux machine, we can install the Datadog agent using the below command. The DD_API_KEY parameter is unique for each account & can be found under the Agents Tab of your Datadog Account Homepage.
After the agent has been installed go to Integrations and click on add aws accounts
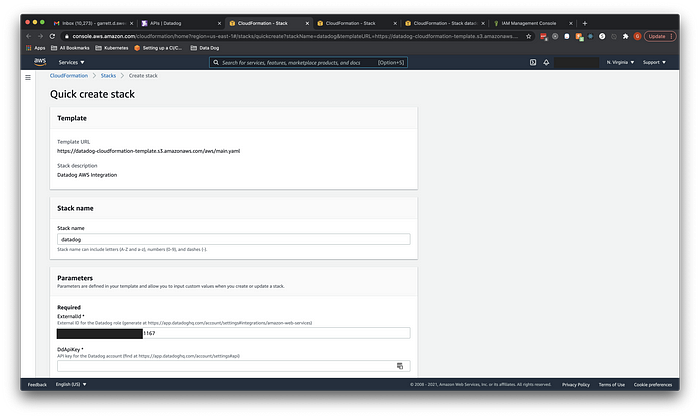
AWS Console and loaded the Datadog Cloudformation stack. Be sure to change the region if you want to deploy the stack in a different region. Simply picking a different region presented the same “Quick create stack” page.

To get the DdApiKey, I went back to the Datadog page and selected the “Datadog API key” link that now appeared in the New Account window.
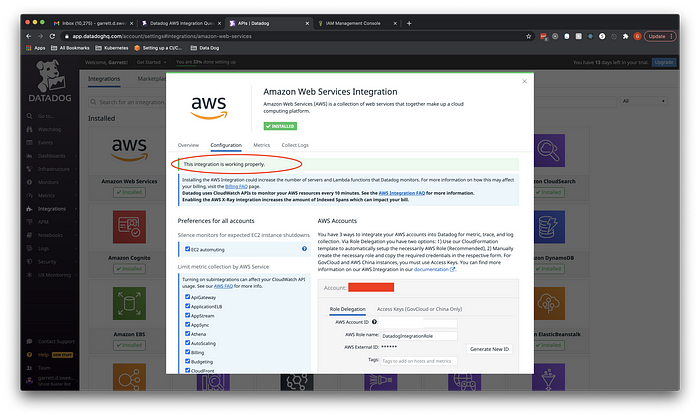
Hooray! Datadog is now connecting to the AWS Account.


No comments:
Post a Comment